Python Visualization Using Seaborn
Now i will sharing about Python. I here i will sharing python for Data Scientist which is Python capable for create statistic data. Please look at the picture below :
 |
The Statistic data not only using Excel, Minitab or SPSS application, but you can use Python for statistic data.
Before we would to use Python, we have to prepare the software and libraries :
1. We have to install application anaconda navigator.
You can download in Anaconda.com ( Open Source and Free )
2. After download and Install, you can running Anaconda Navigator

3. Then please check at tab environment, then colomn installed, Pandas and Seaborn was installed or not?


if Libraries displayed such as the picture above. your application has libraries installed.
If not displayed, you have to install libraries.
Running command prompt Anaconda Powershell Prompt


If you like these article, please like, share and comment.
also please follow & connect our social media in linkedin :
https://www.linkedin.com/in/arifin-hidayat-884a66115/
Youtube Channel Sharing Knowledge
Also please visit to our article :
Read our article Pharmaceutical HVAC
Read our article AC Split
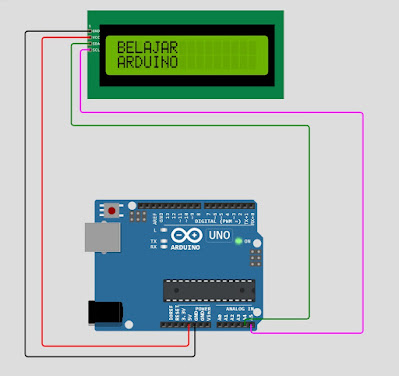
Read our article Basic of Arduino
Read our article Cropping Image with Shape at Power Point
Read our article Brazing
Read our Article Basic of Fire Extinguisher
Read our article White Belt Certification Lean Six Sigma
Read our article Welding Knowledge
Baca juga artikel Dasar Pengelolaan Limbah B3
Baca juga artikel Building Maintenance
Baca juga artikel Penerapan 5R atau 5S
Baca Artikel Dasar Trafo
Baca juga artikel Dasar Dasar HVAC

Comments
Post a Comment